

 FV Recycling
Commercial Waste Management: How Do You Audit Without Disruption?
A commercial waste audit doesn't require shutting down your facility or pulling supervisors off the floor. Pick one week, two waste streams, and...


![]()
![]()
|
Industrial recycling programs often get reported with a single number - tons hauled, or dollars rebated, and that's usually where the trouble starts. A plant manager sees the tonnage report, finance sees the rebate check, and operations sees a downtime log, but none of those views answer the question of whether the program is actually working. |
The right KPIs connect those perspectives and point to where the next improvement lives.

A single number rarely tells the truth about a commercial waste management program. KPIs separate activity from outcome, which is the entire point of measurement.
A facility can haul more tons year over year simply because production grew, while the program itself flatlines. The same goes for a rebate check; a bigger number this quarter often just means OCC prices ticked up, not that anything in the operation improved.
Well-chosen KPIs do three things at once:
Four KPIs cover the operational, financial, and environmental dimensions of a well-run industrial recycling program. Start with these and cut anything that isn't changing behavior.
| KPI | What It Measures |
|---|---|
| Volume | The share of total waste by weight that leaves the site for recycling, reuse, or recovery instead of landfill. |
| Rebate | The share of a specific material (cardboard, metal, plastic) that actually reaches a recycler versus what's generated on site. |
| Cost Capture | The share of a recycling load rejected or downgraded because of cross-stream material. |
| Equipment Downtime | The all-in cost (hauling, service, equipment lease) divided by tons actually recycled. |
Track volume by material stream, not just as a single site-wide total. Stream-level data is where real decisions get made.
A site that only reports total tons hides too much. Tracking OCC, plastic film, scrap metal, and any other streams separately makes it clear which ones are performing and which ones are quietly slipping. Stream-level volume is also where contamination shows up first. A stream that suddenly drops in clean recovered tonnage usually has rejected loads sitting behind the change.
A few ways to make volume data more useful:
Rebate is the revenue generated by reselling baled material into end markets, and it's the most market-sensitive of the four KPIs. OCC, scrap metal, and plastic film all trade against published indices, so the rebate check rises and falls with commodity prices regardless of what's happening at the plant.
That market sensitivity is exactly why rebate has to be tracked against a benchmark. We track rebate per ton, not just total dollars, and we compare it against the relevant commodity index for each stream. When the per-ton number drops while the index holds steady, that's a quality issue (usually contamination or moisture) not a market issue.
Rebate also reveals stream value in a way volume can't. A small stream of clean aluminum may generate more rebate than a much larger stream of mixed paper, which changes how a facility prioritizes sorting effort and recycling equipment placement.
Cost capture is the disposal cost eliminated by diverting material into the recycling program instead of into open-tops and dumpsters. In most industrial categories, this is the largest line item in the financial case for a recycling program - often well above rebate revenue.
The mechanism is direct: every ton of cardboard that goes through a cardboard baler instead of into an open-top is a ton that doesn't generate a tipping fee, and usually a pull fee on top of it. A facility that adds a baler and shifts cardboard out of the open-top stream can typically reduce pull frequency right away, sometimes cutting weekly pulls in half.
We track cost capture two ways:
Both numbers compound quietly as tipping fees rise in most regional markets, which means a stable program tends to grow its cost capture year over year without any operational change.
Equipment downtime is the share of scheduled operating hours that balers and compactors are unavailable, and it's the KPI most directly tied to the other three. When the baler is down, volume drops, rebate drops, and material that should be baled ends up in an open-top, which means cost capture drops too.
Two causes account for most downtime in industrial recycling programs:
We track wire-related downtime separately from mechanical downtime because the two have different fixes. Wire shortages get solved by building wire delivery into the service schedule so a site never runs out. Mechanical downtime gets solved by the baler service relationship — reactive service turns every failure into a multi-day outage, while scheduled preventive maintenance and fast dispatch keep downtime measured in hours.
Review volume and equipment downtime monthly, rebate and cost capture quarterly, and the full program annually. Matching the cadence to the decision type keeps the program moving without burying anyone in reports.
The monthly review is an operations conversation. Volume by stream and equipment downtime are the numbers that move week to week, and a monthly rhythm gives site supervisors enough signal to correct course before small issues compound into rejected loads or missed pickups.
The quarterly review brings finance into the room. Rebate per ton and cost capture both need a quarter's worth of data before trends stabilize, and the cadence lines up with most billing cycles and commodity pricing reviews. Quarterly is also where vendor performance against the contract gets examined — not in a once-a-year surprise, but as a running conversation.
The annual review belongs to leadership. Reset volume targets against the new baseline, renegotiate vendor terms where the data supports it, and decide whether any streams should be restructured, consolidated, or dropped for the following year.
A review calendar only works when it ends in action. Every review should close with a documented decision — continue, adjust, or escalate — and an owner responsible for making it happen before the next one.
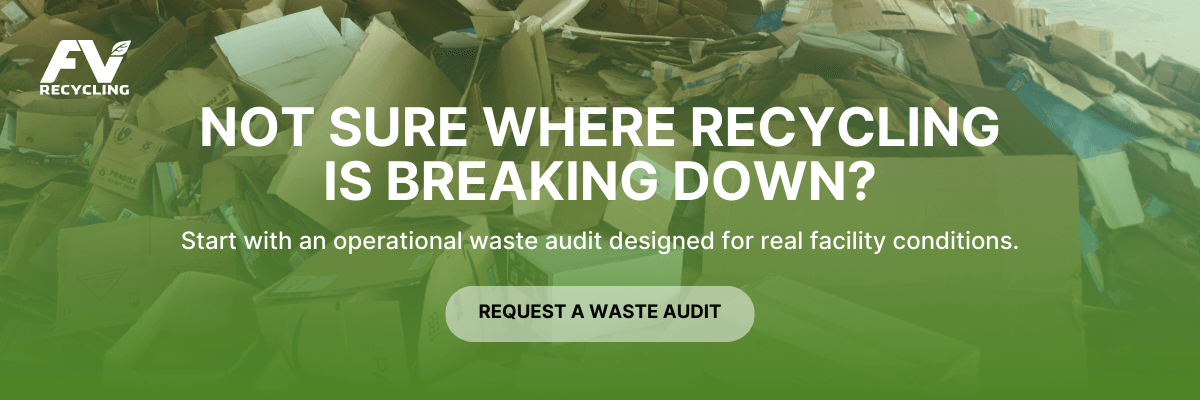
A commercial waste audit doesn't require shutting down your facility or pulling supervisors off the floor. Pick one week, two waste streams, and...
A cardboard baler makes financial sense when a facility generates enough cardboard that hauling loose material becomes inefficient. As volume...
.png)
Standardizing recycling across multiple facilities requires a structured operational framework that aligns material rules, equipment standards,...